Release Version 0.9.0

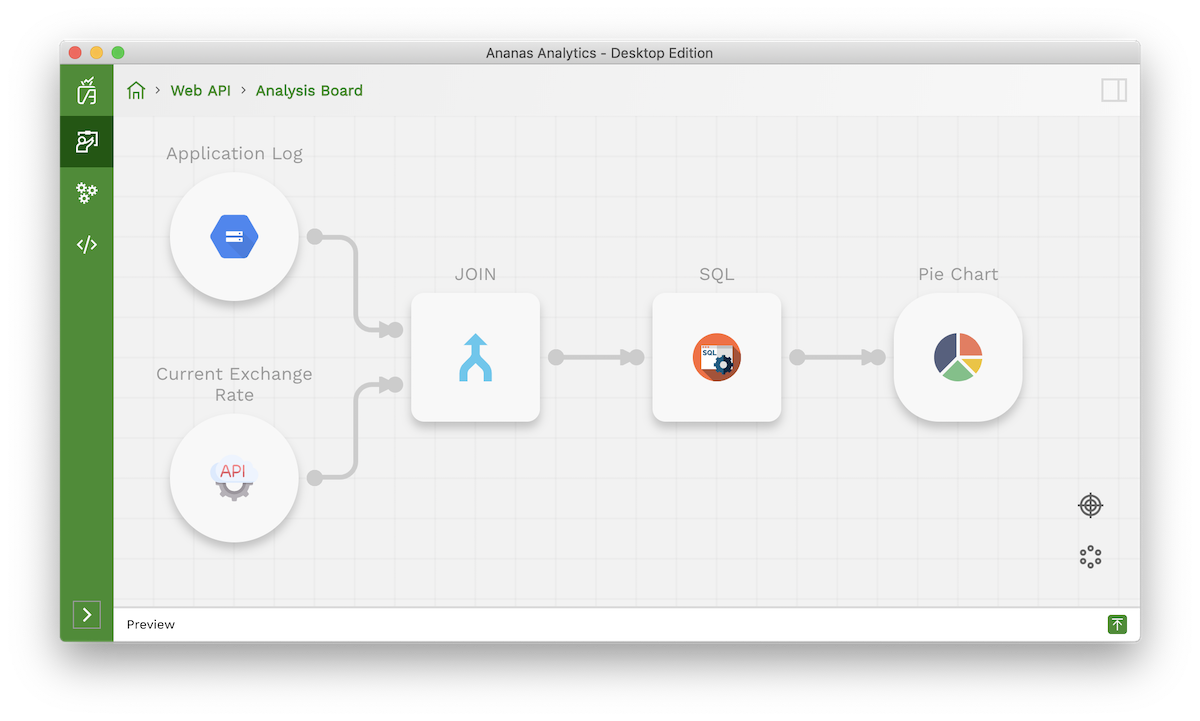
From Ananas Desktop 0.9.0, you can use the new Web API data source to integrate web API into your current data analysis flow.
Web API data source automatically transforms returned JSON data into a data table, so that you can transform it using SQL as any other data sources.
For example, the following exchange rate API returns a JSON string:
GET https://api.exchangeratesapi.io/latest HTTP/1.1

{
  "base": "EUR",
  "date": "2018-04-08",
    "rates": {
    "CAD": 1.565,
    "CHF": 1.1798,
    "GBP": 0.87295,
    "SEK": 10.2983,
    "EUR": 1.092,
    "USD": 1.2234,
    ...

    }

}
Ananas Desktop Web API data source turns it into the following table:
| base | date | rates.CAD | rates.GBP | ... |
|---|---|---|---|---|
| EUR | 2018-04-08 | 1.565 | 1.1798 | ... |
You can also filter the json object with JSON Path. More details please see our user guide.
Another exiting feature we support from 0.9.0 is the Excel data source. You can now forget about the VLOOKUP function in excel and use SQL to join excel tables. It also opens the door for you to integrate excel data with other data sources, for example, a PostgreSQL database. There are plenty of possibilities out there waiting for you to explore.
On visualization side, 0.9.0 brings Pie chart into the visualization collection. And we enhanced the Bar chart with additional settings. You can now use the same bar chart step to visualize your data in a stacked way or side by side way, vertically or horizontally
Several new command line interfaces are introduced in 0.9.0 to help engineers integrate Ananas into their current data workflow.
There are several other improvements included in 0.9.0 too. Here is the release note:
Release Note
New Features
- add new workspace setting
disableCheckUpdateOnStartto disable the update check when start the app - add Web API source. Now it is possible to explore, and analyze data from Web API
- add Excel data source.
- add SQL function
TO_DATEto convert string type data to date type - add
Pie chartvisualization step. - improve
Bar chartvisualization step. Support stacked bar chart, horizontal bar chart and vertical bar chart - add
Find project in file exploreroption in project selection view to locate project folder - add new
StringMapcomponent for step editor. It allows editor to edit string-string type map - add new CLI
explorecommand to explore data source - add new CLI
viewcommand to get visualization step result - add new parameter
hosttostartcommand to specify the server host - add new example
Temperature Forcast. See ananas-examples - add new example
MySQL. See ananas-examples - add new example
PostgreSQL. See ananas-examples - add new example
Excel. See ananas-examples
Bug fixes / Improvements
- Fix the issue that CLI exits with code 0 when meeting error in some cases
- Fix the issue that CLI
startcommand listens to0.0.0.0:3003by default. Now it listen to127.0.0.1:3003by default - Fix derby access issue when
runa visualization step from CLI - Upgrade sparkjava dependency to version
2.9.1 - Fix a issue that keep loading the project that is deleted from disk
- Fix Linux & Window new version update dialog has no acknowledge button issue
- Fix
ananasprocess not being killed when close app on MacOS issue - Improve postgres schema auto detection
- Improve several error messages
- Improve tests