Visualizing

Visualizing your data
You can visualize your data by running a job in a visualization step.
Drag & drop one of the visualization step
Connect the visualization step to the step of your choice
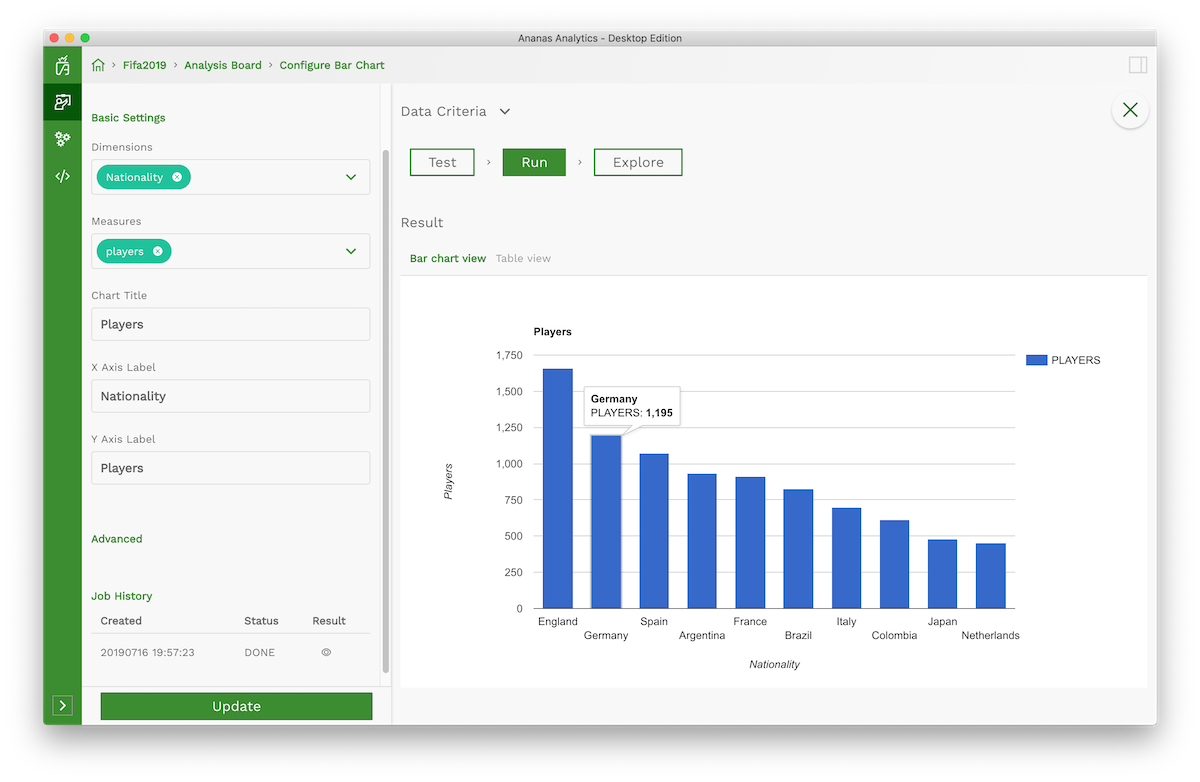
Choose the dimensions X and Y of your choice
Choose the measures which will be the actual Y values.
Click
testbutton to make sure you didn't miss any field.Now it's time to run your job to compute your measures on all data. Click
run.If the job has completed successfully, you should see its state as
DONE.Click
Exploreto vizualize your data.Refine your chart by changing the SQL query in advanced settings
Congratulations you've got a chart in minutes.
Once you've run your visualization job, intermediate data is stored in your desktop. This means you don't have to run it again whenever you change your SQL query to filter the data for visualization.
Advanced settings
Beware that sometimes it's useful to order your X and Y axis by sorting them in the Query. Any updates can be done directly in the Query. For example use the SQL ORDER BY and click explore button to display X in order.
